Search the Community
Showing results for tags 'memory'.
Found 6 results
-
Hi, I've some question about the dopNet, and the memory performance: I currently query the memory used in the simulation in this way def memConsumed(): try: sim = hou.node("../.").simulation() return "%s" %(str(hou.DopSimulation.memoryUsage(sim)*0.000001)) except: return "NONE" sys.stderr.write("\nMEM CONSUMED : %s MB" %(memConsumed())) A) Is working but the memory usage is quite different off from the memoryGrowth on the performance profile, is this last on reliable for the dopNet? I'm looking some method to go more in deep, I saw every object have record of the memusage, but unfortunately this one is not the sum of every child dependency in the network, example: memmoryUsage(x) = 10000000000 SIM_Objcet > 100 SIM_SolverMulti > 150 SIM_SolverSop(01) > 75 GAS_SubStep > 5000 ... > 30 ... > 999999 SIM_SolverSop(02) > 350 It may have sense to check the "self memory consumed", but in a debug prospective this is not really efficient IMHO Is there anyway to have the memusage as a sum of the relative child? C) are there any record field to describe if any gas solver is multi thread or not? right now the only way that I've is tun a profile and check rolling over for each micro-solver. D) any way to read the time usage for each node? (without dealing with the infoTree, I was expecting sidefx putting a field in the basic record for that like memusage ) E) there is anyway to append the profile file .hperf frame by frame? right now I'm saving a profile by stubstep so far this is my output SIM TIME : 14.25 Frame MEM CONSUMED : 43.389147 MB TIME CONSUMED: 0:00:02.204154 s POINTS : 508702 --- SIMULATION DATA --- Object: staticobject1 |_ MEM USAGE : 0.000361 MB |_ DATA TYPE : SIM_Object Object: HELLO |_ MEM USAGE : 0.000561 MB |_ DATA TYPE : SIM_Object |_ surface FIELD: | |_ DIV SIZE : 0.01 | |_ VOXEL COUNT : 198476 | |_ SIZE : [0.58, 0.59, 0.58] | |_ SLICE : 0 | |_ MEM CONSUMED : 0.772624 MB |_ vel FIELD: | |_ MEM CONSUMED : 0.722936 MB |_ pressure FIELD: | |_ MEM CONSUMED : 0.003616 MB |_ collision FIELD: | |_ MEM CONSUMED : 0.003616 MB |_ collisionvel FIELD: | |_ MEM CONSUMED : 0.007688 MB |_ source FIELD: | |_ MEM CONSUMED : 0.0036 MB |_ viscosity FIELD: | |_ MEM CONSUMED : 0.0036 MB |_ stickvel FIELD: | |_ MEM CONSUMED : 0.007688 MB |_FORCES: |_ Gravity_gravity1 |_ MEM CONSUMED : 0.000584 MB ------------------------------------------------- Profiler stopped and archived Profiles saved: /xxxxx_20180904_10_51_19/14.25.hperf (note the field are a list of interested one) I still need to work to read the solver process and collect all the info to process a % print thanks, Simone.
-
When trying to put a guide simulation on my fur, houdini starts cookingOP and after 1 min 30 sec it gives me the error : "memory allocation error occured, probably duo to insufficient memory" and crashed. Anyone knows how to solve this ? Kind regards Specs: CPU: Intel core i7 16 GB ram GPU: Nvidea quadro m2000m houdini 16.5.323
-
I am putting a new computer together. I am in doubt of how much memory I am going to use. My current configuration is 2x GTX 1080ti and 64GB of ram. I am rendering all my stuff in Octane, and can therefore benefit of the two 1080ti's. But I don't know if 64GB ram is enough. Are you guys, and girls often experiencing that your simulations is maxing out at least 64GB ram, when simulating stuff? The alternative, would be 128GB ram and only one 1080ti. (64GB ram cost about the same as a 1080ti)
-
Hello, I noticed when flipbooking viewport that Mplay eats a lot of memory. For example when I flipbook 200 frames, according to Task Manager it will take 2.7 GB of RAM. Is there any way to decrease it? I don't need flipbook to be high quality - I suspect that it stores images in hdr. Thanks, Juraj
-
Hi guys! I'm having problems with the Whitewater solver. My memory fills up and around 360 frames I crash. I've read the following article about it: https://www.sidefx.com/index.php?option=com_forum&Itemid=172&page=viewtopic&t=37350&sid=c91c1025b83c0c6f7780e546ec4248d1 But I don't think this applies to my scene. I've written out the entire .sim sequence from my DOP network (I needed all the collision data as well) so all the fields should be there. Just as a precaution I've loaded only the "surface" and "vel" fields via a dopfields import as my whitewater source. So that no irrelevant data is loaded into the whitewater sim. This seems to be working correctly. No matter how I cache the White-water solve though...my memory always seems to fill up rather quickly and eventually crashes my houdini. the scene is rather large though...but I'm writing directly to disk. Am I missing something? any comments or advice is, as always, greatly appreciated .
-
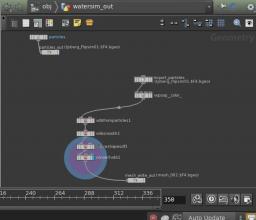
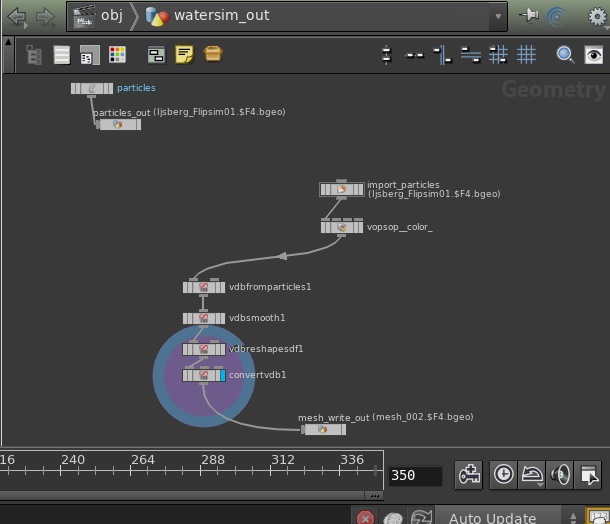
 Hi, I've seen a few topics on this subject, but none actually solved the issue in the end. So here's the problem: I'm writing out a flip mesh (vdb) to disk (using the rop output driver), and the first 1-2 frames go just fine (takes +- 3 min per frame). Of course Houdini uses a lot of RAM for this, but the problem is that it doesnt flush it after its finished writing out a frame. The cache stays, and houdini doesnt free up the memory, causing the whole computer to slow down (it then takes like 3 hours to write out 1 frame!). Is there a way to clear the node cache/memory after cooking a frame?flushing the cache from the cache manager isn't really possible (since I'd need to stop the writing after every frame). After i stop the writing, the memory only frees up again after I actually close houdini. p.s. I have an AMD FX8320, with 12GB RAM and a weta digital 3TB green HDD. Using houdini 13, on windows 7.