Search the Community
Showing results for tags 'visualization'.
Found 12 results
-
 Hi guys, Vellum solver has some visualization modes. How can I create an attribute based on one of them, for say “Stretch Distance” ? Thanks for helping Vellum visualization.hip
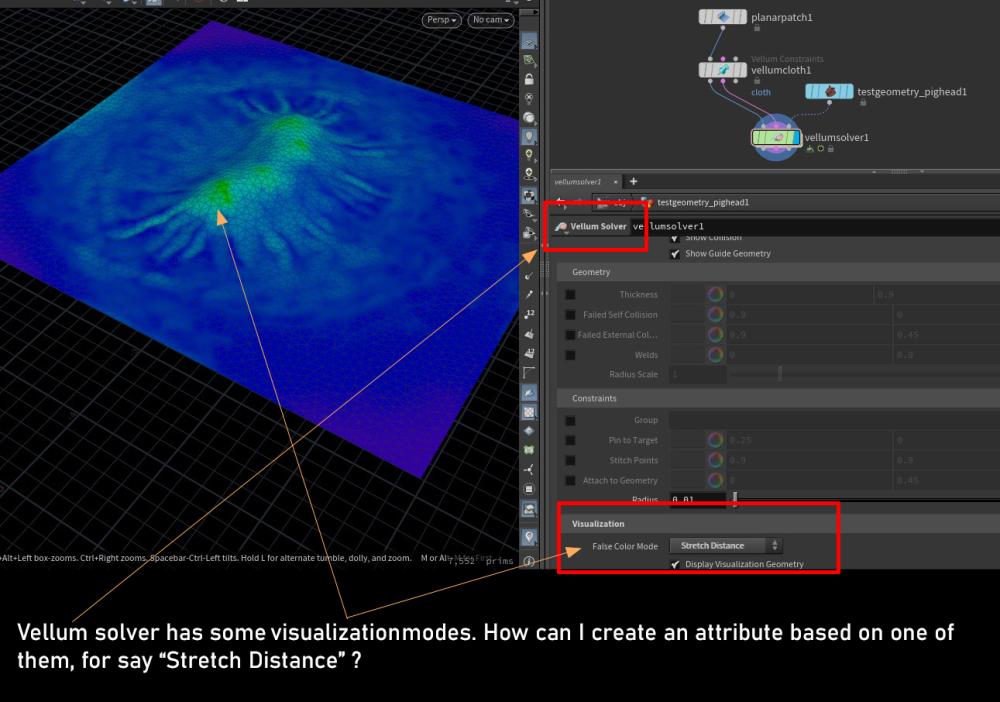
-
The Advanced Visualization Lab (AVL) at the National Center for Supercomputing Applications at the University of Illinois at Urbana-Champaign is looking for a Houdini artist for an hourly contractor position, expected to be <10 hours per week. The position is remote. The work would involve helping the AVL team create cinematic scientific visualizations of datasets like black holes and stars. Prior visualization experience not required. Please see the attached job description and AVL demo reel to get a sense for the type of work. Apply here: https://forms.illinois.edu/sec/1933699974 Houdini_Artist_Job_Description.pdf
-
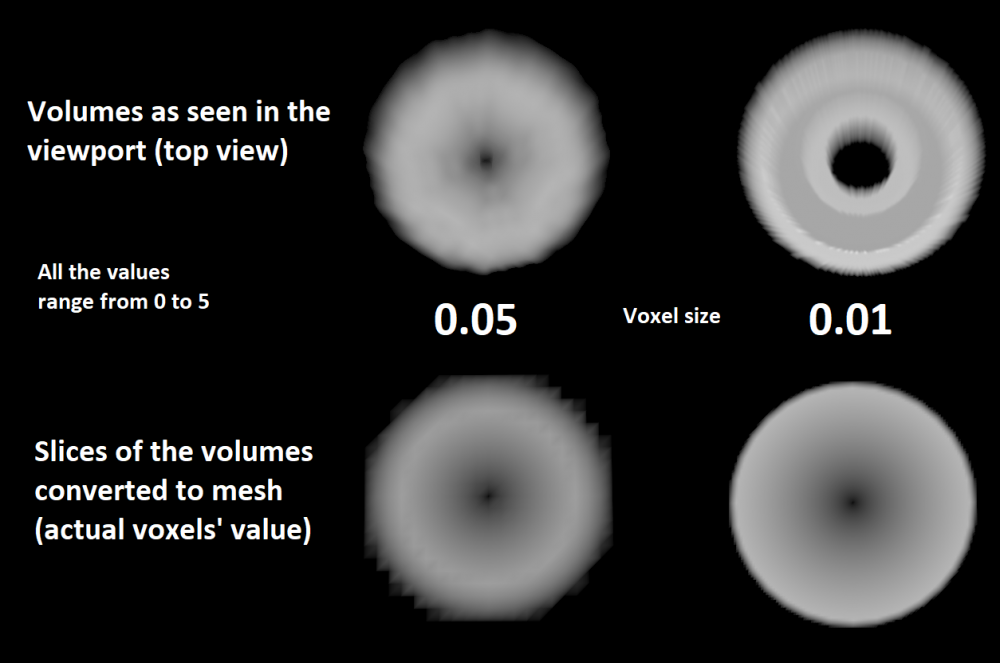
Hi everyone, I want to modify some very basic volume (created with a vdbfrompolygons) with a VOP network. I'm very new to this kind of volume manipulation and I'm having difficulties with the visualization of the volume in the viewport. When I decrease the voxel size of the VDB, a stepping appears in the volume viewport visualization. (The mantra render is ok) This bother me because I plan to do A LOT of manipulation in the VOP and it would pain me to do a render at every single modification of the network. Am I missing something obvious? It's hard to explain so I linked a picture that showcases what I mean with the .hip Thx for any help VoxelSizeProblem.hipnc
-
..
-
Hopefully this is helpful to others. Small snippet to visualize the different noise's. I have not put them all in, but if you feel inclined please add more and reply-post. You will need to create the menu (as this does not seem possible in VEX and has to be done via the parameter interface? and a 100x100 grid as input. // // Houdini Noise visulization - Curtis // int NoiseMenu = ch("NoiseMenu"); // Create a Ordered Menu "NoiseMenu", In the "Pram Interface", //Token, Lable ... // 0 vnoise // 1 wnoise // 3 flownoise // 4 curlnoise // 5 xnoise // 6 random // 7 alligator float frequency = ch("frequency"); float rough = ch("roughness"); float atten = ch("attenuation"); float jitter = ch("jitter"); int turbulence = ch("turbulence"); int flow = ch("flow"); int seed = ch("seed"); //Noise data vector vp0, vp1; float output1=0; float output2=0; //No Case stament in VEX ... elseif it is.. if ( NoiseMenu == 0 ){ //vnoise VEX function //Generates Voronoi (cellular) noise. vnoise(@P, set(jitter, jitter, jitter), seed, output1, output2, vp0, vp1); } else if ( NoiseMenu == 1){ //wnoise VEX function //Generates Worley (cellular) noise. wnoise(@P, @P.z*frequency, output1, output2); //general noise } else if ( NoiseMenu == 2){ //snoise VEX function //functions are similar to wnoise. output1 = snoise(@P, turbulence, rough, atten); } else if ( NoiseMenu == 3){ //flownoise VEX function (soft) //Generates 1D and 3D Perlin Flow Noise from 3D and 4D data. output1 = flownoise(@P*frequency, flow); } else if ( NoiseMenu == 4){ //curlnoise VEX function //Computes divergence free noise based on Perlin noise. output1 = curlnoise(@P*frequency); } else if ( NoiseMenu == 5){ //xnoise VEX function //Simplex noise is very close to Perlin noise output1 = xnoise(@P*frequency); } else if ( NoiseMenu == 6){ //random VEX function //Generate a random number based on the position in 1-4D space. output1 = random(@P*frequency); } else if ( NoiseMenu == 7){ //anoise VEX function //Generates "alligator" noise. output1 = anoise(@P*frequency,turbulence, rough, atten); } //Output to 100x100 grid as colour @Cd = output1;
-
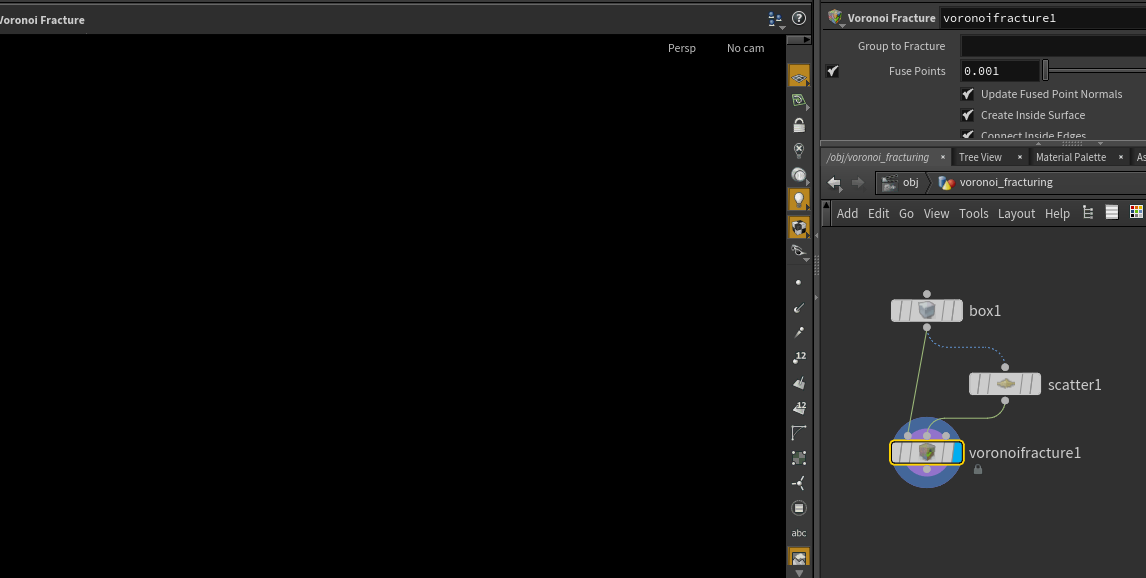
 Hello, I'm having trouble with this simple project (I'm new to Houdini). If I click on the box object I can see it on the viewport, but if I click the scatter or the voronoi then the viewport goes empty. I have "Show all objects" checked but it doesnt change.
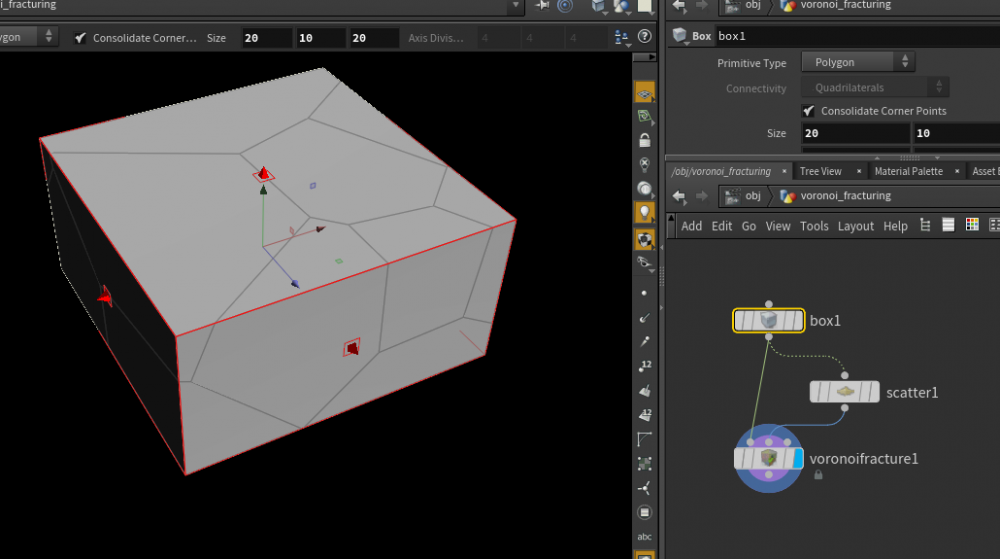

-
Hi, can't make work the "Wire Visualization" node in H17? Did anyone experience this? Bretislav
-
Hi, can't make work the "Wire Visualization" node in H17? Did anyone experience this? Bretislav
-
 Hi! This is what I did: I made a cool sim with wires and constraints, it works all fine but I decided that I wanted those colored polylines that are drawn by the sim for the constraints. So I created another geo node and object merged the "Visualization" geo from the Constraints Network, It worked! but with a little problem, If I scrub through the animation timeline sometimes I get the "static" state of the constraints, this can be solved If I just scrub a little more near the frame that has the problem, sadly it happens again in another frame (randomly) I guess that my trick is a little dirty and Houdini doesn't like it. Is there anyway I can import this visualization geo as seen inside the DOP Network? Here is my file, It's a little messy (weird experimentation) so sorry for that. Just Press Play and you should see the problem. DynamicWireConstraints_personal.hipnc Houdini 16.5 NC
 -
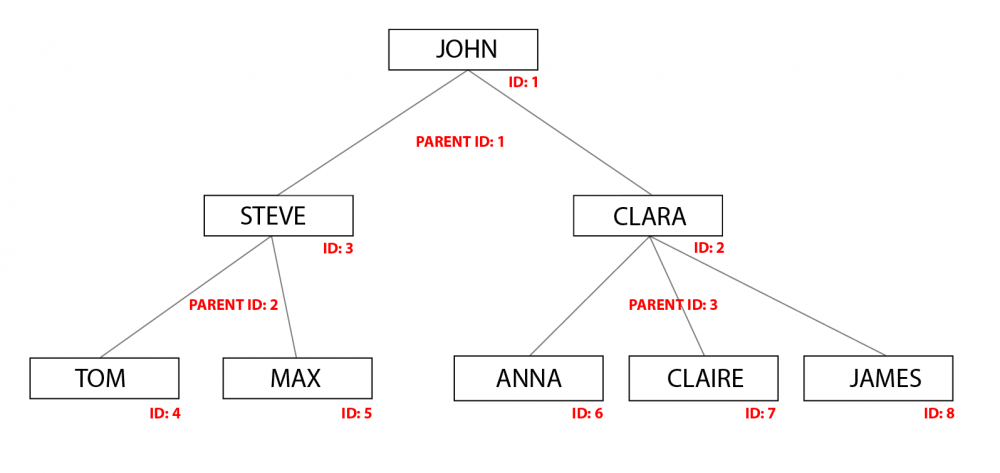
Hello! I'm trying to visualize data from a csv file as a node tree (similar to Houdini's Network View). I also want to be able to animate it's sequential growth from top to bottom. What would be the best approach to do this? I'm familiar with getting data into Houdini via the Table SOP. But I can't quite figure out how to do the tree structure. I've attached some sample data and a corresponding mockup. Thanks in advance! NodeGraph_Data.csv
-
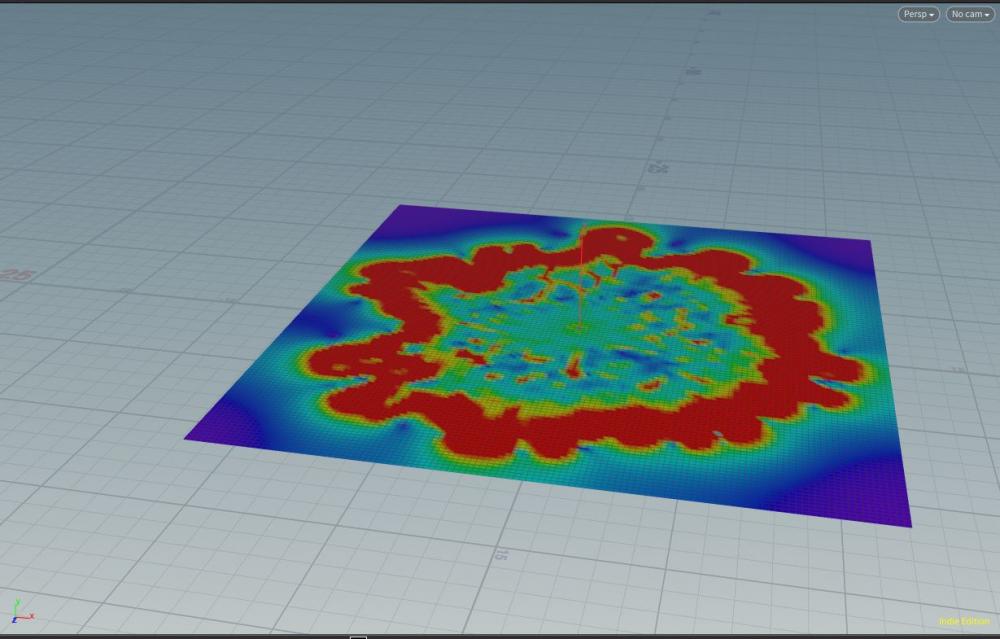
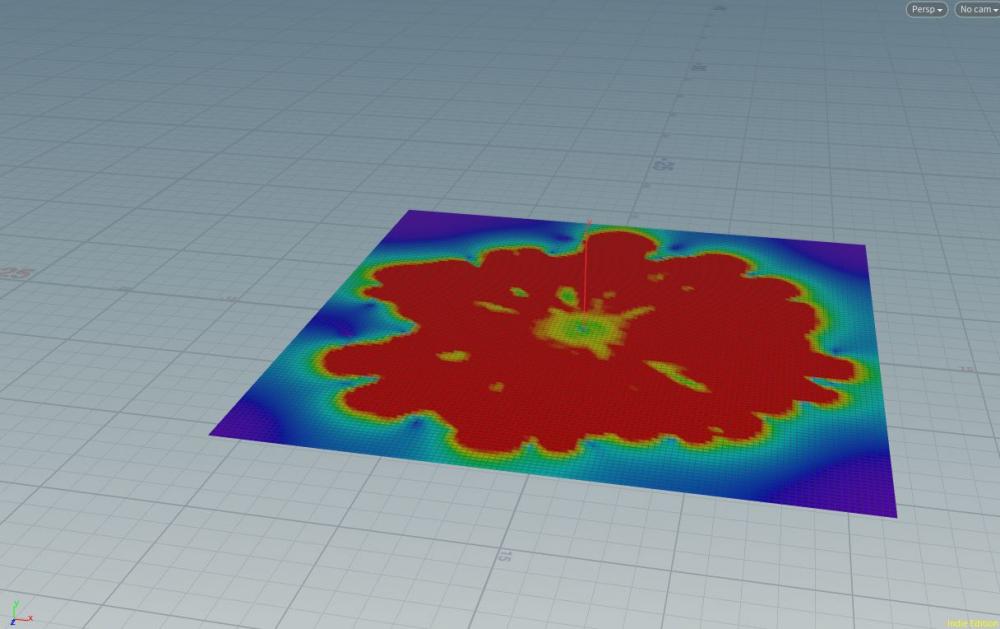
Hey! Is this normal behavior? I am trying to visualize the velocity field of my pyro simulation, but the position of the plane on the y axis keeps shifting up and down which makes some frames look completely different because it is looking at a different y position of the sim. It makes it difficult to see if my velocity field is simulating correctly. Look at the two photos below, it seems like the velocity drastically changed, but its actually because the slice moved upwards and it is showing the velocity of a higher part of the sim. Is this normal? Thanks
-
 Similar to the H14 workflow of hitting X on the currently selected node in any vop context to create a visualizer node, I want to do the same but connect the currently selected node to the compute lighting Ce output (or a bind export node set ot Ce but that can throw errors) to quickly visualize the color data of the map I am working on without having to do expensive shader calculations. The visualize node is great when working with Cd in SOPS but does not return the same functionality in shaders This is a default hotkey in arnold for C4D, its like alt+w+v or something. I'm sure there is a way to do this with a python script attached to a hotkey. Any ideas?